Worldcastr helps people explore how the places around them may change. Our live product brings together residential value forecasts, geographic context, and a range of possible outcomes over the next one to five years.
You can search for a place, choose a forecast year, and compare lower, central, and higher estimates. Teams can also access forecast data through our API to use in their own applications and analysis.
We are starting with residential values because they are a concrete part of a larger question: how does a place develop over time? A useful answer needs a location, a time horizon, and an account of what remains uncertain.
Explore a place
The search bar takes you into Worldcastr’s map and forecast experience. Start with an address, a neighborhood, or a city. On the homepage, the example explorer lets you inspect East Austin, Downtown Flushing, and Brickell without leaving the page.
Each example shows the estimates together and lets you change the year. You can open the full report for more geographic context and the underlying methodology. Keeping the horizon fixed makes it easier to compare places; changing it lets you examine how the outlook develops over time.
See more than a central estimate
A central forecast is useful, but it leaves out how widely outcomes might vary. Worldcastr displays the modeled range alongside it. Two areas with similar central estimates can have very different spreads.
The range is part of the forecast, rather than a separate confidence badge. Our methodology describes how forecasts are evaluated against held-out outcomes, including interval coverage and comparisons with a baseline that carries the last observed value forward.
From forecasts to planning
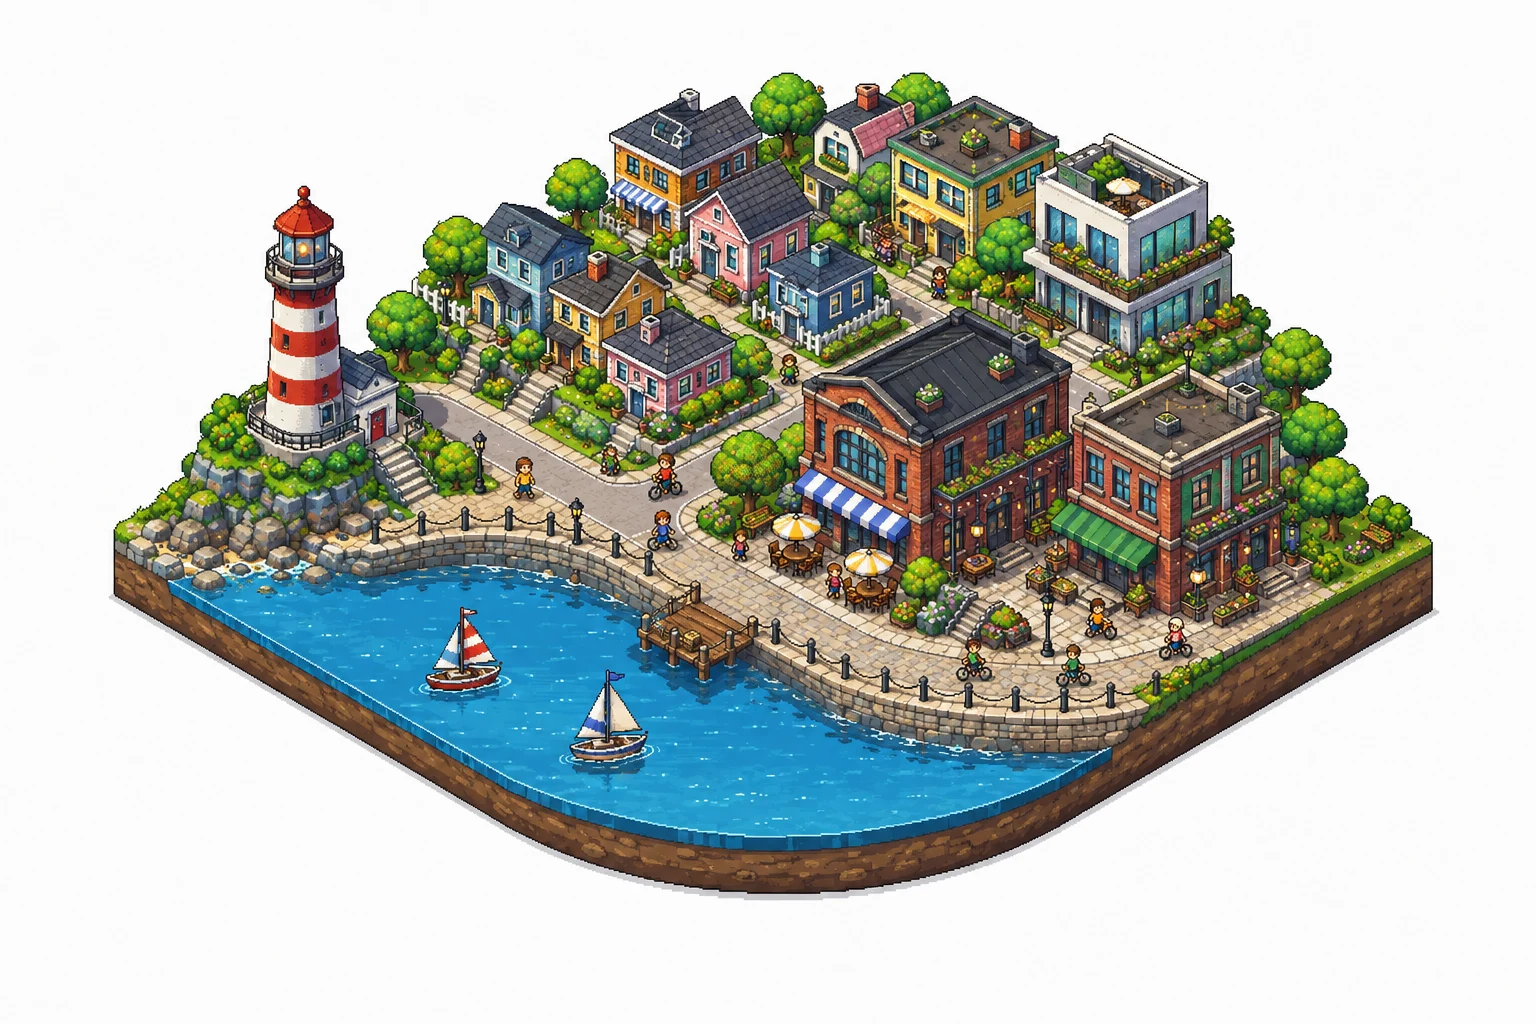
The neighborhood illustration introduces a broader planning workflow. Follow one location through time, explore alternative future scenes, or switch to a baseline-versus-intervention comparison. The same streets and landmarks remain visible so you can see which parcels change.
These scenes are illustrative. They do not forecast the construction of individual buildings in 2040. Today’s live forecasts cover residential values over one to five years, and the methodology explains their scope, data sources, and limitations.
Worldcastr is available on the web. Explore a neighborhood to get started, or visit the teams page to discuss the geography and decision your organization is working on.